Market Research with Real-Time
Airbnb Data
Find the most profitable zip codes. We aggregate millions of data points to show you exactly where the money is flowing.
Market Overview
Key Market Indicators
Essential metrics, updated daily. No noise, just the numbers that matter.

Average Daily Rate across all listings.
Percentage of nights booked over available nights.
Revenue generated per available room.

Total number of active Airbnb listings.
Trends & Graph
AI-Driven Market Trend Analysis
2-year historical data visualization. Validate market stability with a single glance. Visualize pricing and occupancy trends.
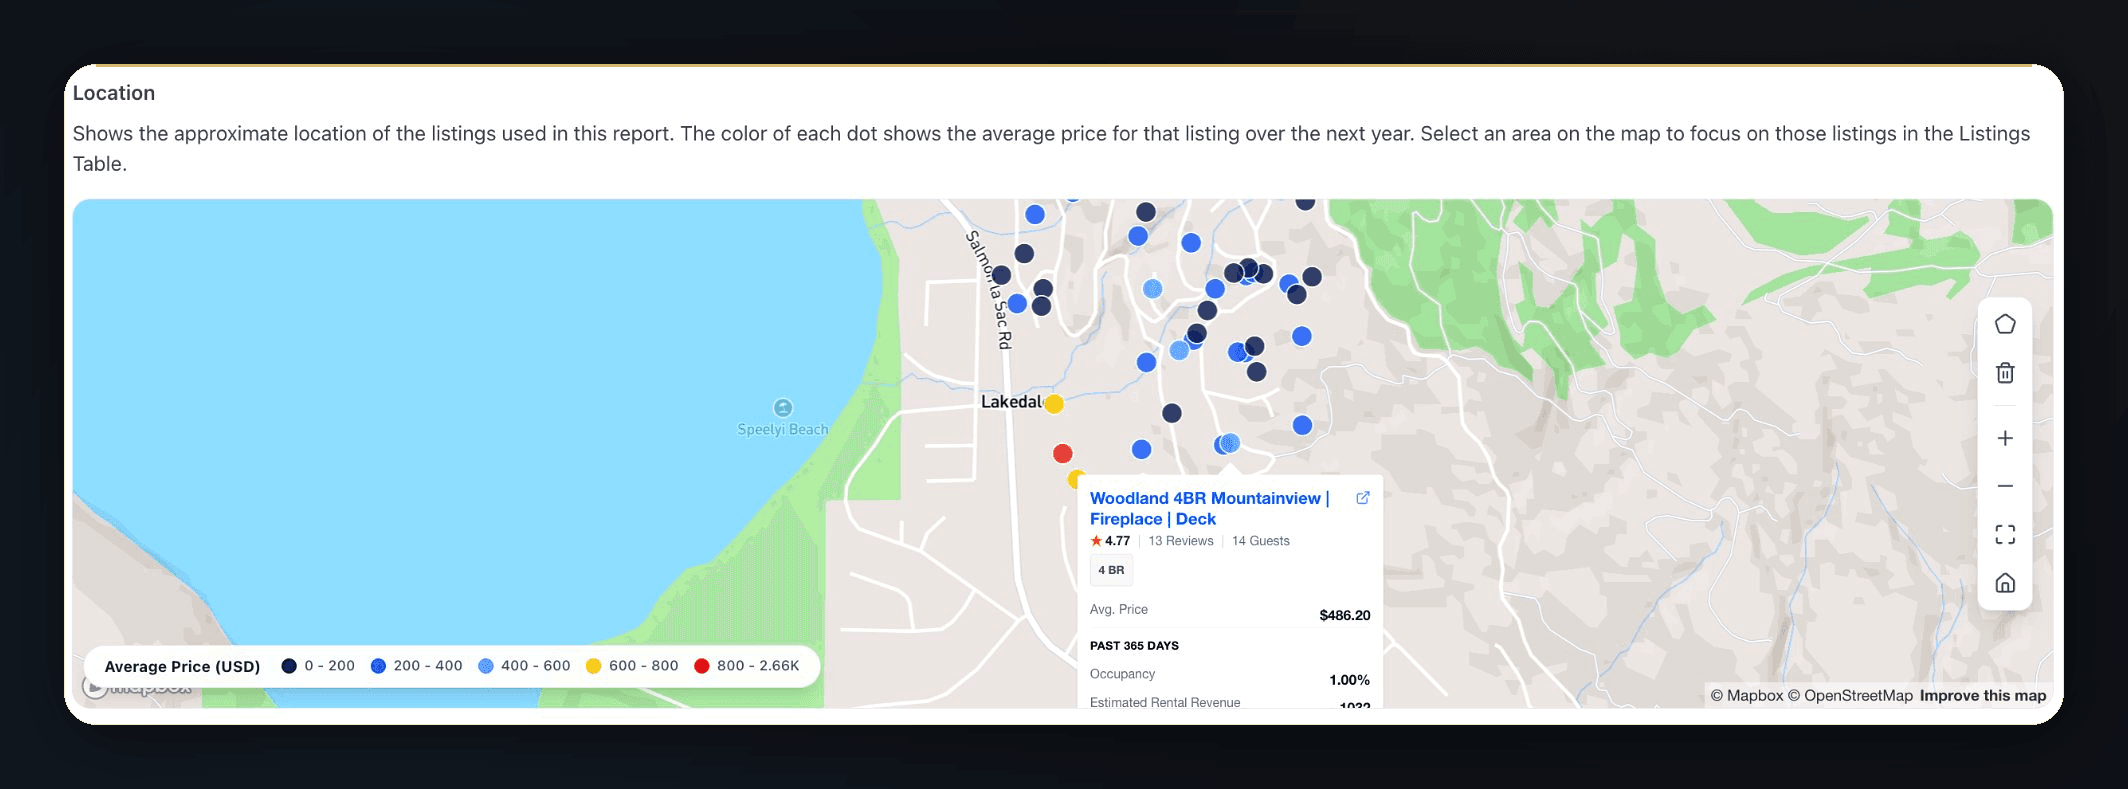
Interactive Map
Visualize Market Activity
From state view to zip code view. Understand regional dynamics instantly.
Start Using Insidebnb Market Research Today
Get access to in-depth, real-time Airbnb market data and unlock better opportunities.
Testimonials
Trusted by Profitable Investors
Real reviews from our satisfied customers and property owners.
- 内容待定内容待定内容待定内容待定内容待定内容待定内容待定内容待定 内容待定内容待定内容待定内容待定 内容待定内容待定内容待定内容待定 内容待定内容待定内容待定内容待定 内容待定内容待定内容待定内容待定 内容待定内容待定内容待定内容待定